Observability Integration
Overview
This article describes how to configure Nginx Ingress to integrate with monitoring and logging systems to enhance observability, including integration with Tencent Cloud's managed Prometheus, Grafana, and CLS products, as well as integration with self-built Prometheus and Grafana.
Integrating Prometheus Monitoring
If you use Tencent Cloud Prometheus Monitoring Service associated with TKE cluster, or have installed Prometheus Operator yourself to monitor the cluster, you can enable ServiceMonitor to collect Nginx Ingress monitoring data. Simply turn on this switch in values.yaml:
commonLabels:
  prom_id: prom-xxx # Specify Prometheus instance ID through this label so the ServiceMonitor can be recognized by the Prometheus instance
controller:
  metrics:
    enabled: true # Create a dedicated service for Prometheus to use for Nginx Ingress service discovery
    serviceMonitor:
      enabled: true # Deploy ServiceMonitor custom resource to enable monitoring collection rules
Integrating Grafana Monitoring Dashboards
If you use Tencent Cloud Prometheus Monitoring Service associated with TKE cluster and have associated Tencent Cloud Grafana Service, you can directly install Nginx Ingress monitoring dashboards in the Prometheus integration center:

If using self-built Grafana, simply import the two monitoring dashboards (json files) from Nginx Ingress's official Grafana Dashboards into Grafana.
Integrating CLS Log Service
Below describes how to collect Nginx Ingress Controller's access logs to CLS and analyze logs using CLS dashboards.
- Configure the nginx access log format in
values.yaml, and set the timezone so timestamps display local time (enhancing readability):
controller:
  config:
    log-format-upstream:
      $remote_addr - $remote_user [$time_local] "$request"
      $status $body_bytes_sent "$http_referer" "$http_user_agent"
      $request_length $request_time [$proxy_upstream_name] [$proxy_alternative_upstream_name] $upstream_addr
      $upstream_response_length $upstream_response_time $upstream_status $req_id $host
  extraEnvs:
    - name: TZ
      value: Asia/Shanghai
-
Ensure log collection is enabled for the cluster. Refer to official documentation Enabling Log Collection.
-
Prepare CLS logset and log topic for Nginx Ingress Controller. If you don't have them, go to CLS Console to create them according to your needs, then record the log topic ID.
-
Follow the screenshot guide to enable indexing for the log topic:
- Enter the log topic's Index Configuration page and click Edit:

- Enable indexing, full-text delimiters:
@&?|#()='",;:<>[]{}/ \n\t\r\\:
- Batch add index fields (keep configuration consistent with the screenshot):
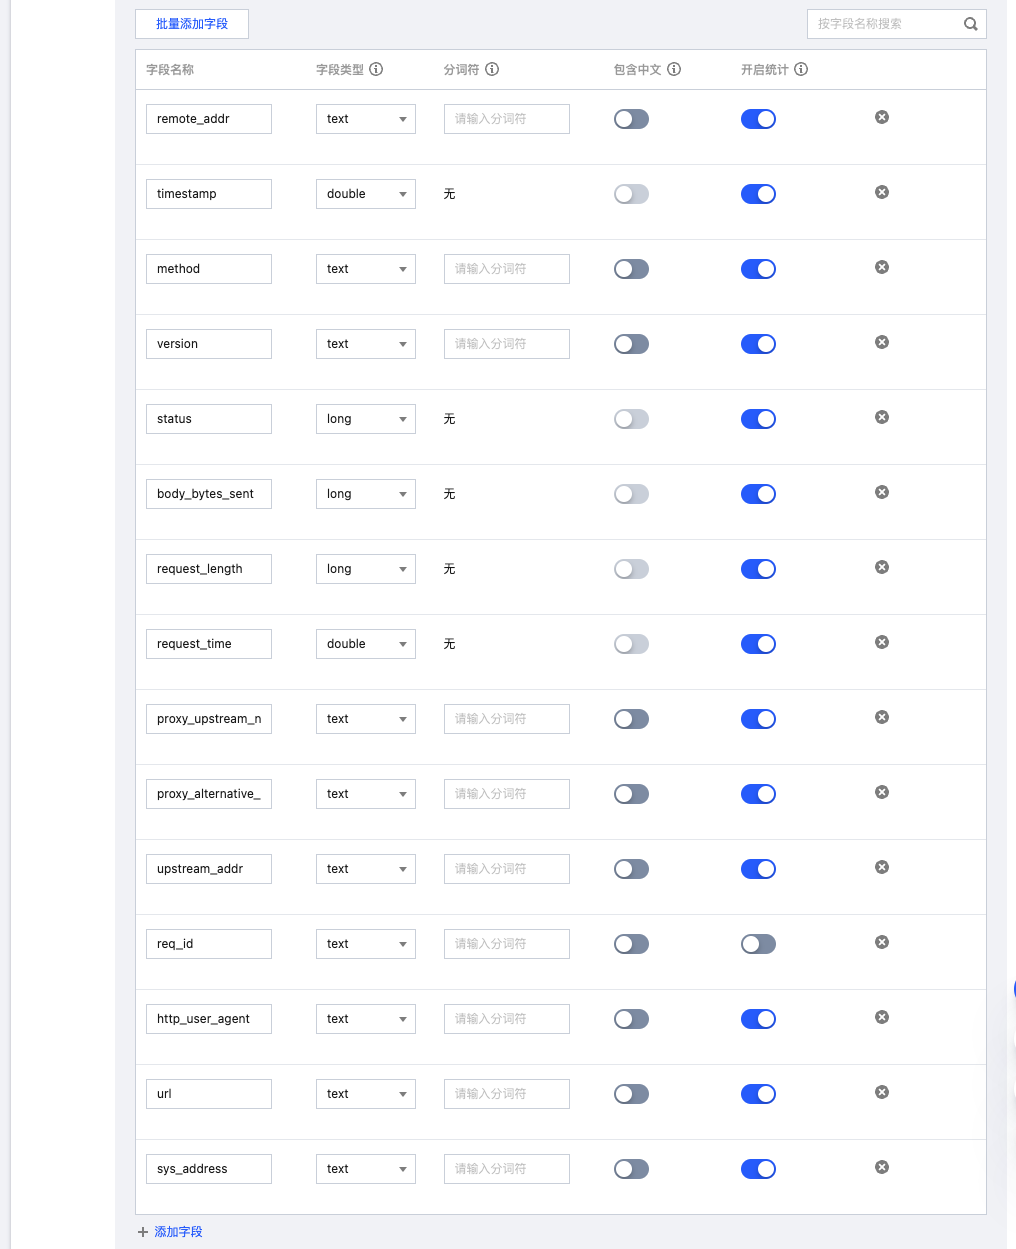
- Advanced settings:

- Enter the log topic's Index Configuration page and click Edit:
-
Create TKE log collection rules:
- Collect Standard Output
- Collect Log Files
apiVersion: cls.cloud.tencent.com/v1
kind: LogConfig
metadata:
  name: ingress-nginx-controller # 日志采集规则名称,如果是多个 nginx ingress 实例,这里不能冲突
spec:
  clsDetail:
    topicId: "********-****-****-****-************" # 替换日志主题的 ID
    logType: fullregex_log
    extractRule:
      beginningRegex: (\S+)\s-\s(\S+)\s\[([^\]]+)\]\s\"(\w+)\s(\S+)\s([^\"]+)\"\s(\S+)\s(\S+)\s\"([^\"]*)\"\s\"([^\"]*)\"\s(\S+)\s(\S+)\s\[([^\]]*)\]\s\[([^\]]*)\]\s(\S+)\s(\S+)\s(\S+)\s(\S+)\s(\S+)\s(\S+)
      logRegex: (\S+)\s-\s(\S+)\s\[([^\]]+)\]\s\"(\w+)\s(\S+)\s([^\"]+)\"\s(\S+)\s(\S+)\s\"([^\"]*)\"\s\"([^\"]*)\"\s(\S+)\s(\S+)\s\[([^\]]*)\]\s\[([^\]]*)\]\s(\S+)\s(\S+)\s(\S+)\s(\S+)\s(\S+)\s(\S+)
      keys:
        - remote_addr
        - remote_user
        - time_local
        - timestamp
        - method
        - url
        - version
        - status
        - body_bytes_sent
        - http_referer
        - http_user_agent
        - request_length
        - request_time
        - proxy_upstream_name
        - proxy_alternative_upstream_name
        - upstream_addr
        - upstream_response_length
        - upstream_response_time
        - upstream_status
        - req_id
        - sys_address
  inputDetail:
    type: container_stdout
    containerStdout:
      namespace: ingress-nginx # nginx ingress 所在命名空间
      workload:
        kind: deployment
        name: ingress-nginx-controller # 选中 nginx ingress controller 的 deployment 名称
      container: controller
apiVersion: cls.cloud.tencent.com/v1
kind: LogConfig
metadata:
  name: ingress-nginx-controller # 日志采集规则名称,如果是多个 nginx ingress 实例,这里不能冲突
spec:
  clsDetail:
    topicId: "********-****-****-****-************" # 替换日志主题的 ID
    logType: fullregex_log
    extractRule:
      beginningRegex: (\S+)\s-\s(\S+)\s\[([^\]]+)\]\s\"(\w+)\s(\S+)\s([^\"]+)\"\s(\S+)\s(\S+)\s\"([^\"]*)\"\s\"([^\"]*)\"\s(\S+)\s(\S+)\s\[([^\]]*)\]\s\[([^\]]*)\]\s(\S+)\s(\S+)\s(\S+)\s(\S+)\s(\S+)\s(\S+)
      logRegex: (\S+)\s-\s(\S+)\s\[([^\]]+)\]\s\"(\w+)\s(\S+)\s([^\"]+)\"\s(\S+)\s(\S+)\s\"([^\"]*)\"\s\"([^\"]*)\"\s(\S+)\s(\S+)\s\[([^\]]*)\]\s\[([^\]]*)\]\s(\S+)\s(\S+)\s(\S+)\s(\S+)\s(\S+)\s(\S+)
      keys:
        - remote_addr
        - remote_user
        - time_local
        - timestamp
        - method
        - url
        - version
        - status
        - body_bytes_sent
        - http_referer
        - http_user_agent
        - request_length
        - request_time
        - proxy_upstream_name
        - proxy_alternative_upstream_name
        - upstream_addr
        - upstream_response_length
        - upstream_response_time
        - upstream_status
        - req_id
        - sys_address
  inputDetail:
    type: container_file
    containerFile:
      namespace: ingress-nginx # nginx ingress 所在命名空间
      workload:
        kind: deployment
        name: ingress-nginx-controller # 选中 nginx ingress controller 的 deployment 名称
      container: controller
      logPath: /var/log/nginx
      filePattern: nginx_access.log
- The configuration that must be replaced is
topicId, i.e., the log topic ID, indicating that collected logs will be sent to this CLS log topic. - Choose to configure collection of standard output or log files according to your actual situation. Nginx ingress outputs logs to standard output by default, but you can also write logs to log files as described in Log Rotation.
-
Test Ingress requests to generate log data.
-
Go to the Search and Analysis page in the log service console, select the log topic used by nginx ingress, and confirm logs can be searched normally.
-
If everything is normal, you can use the log service's Nginx Access Dashboard and Nginx Monitoring Dashboard preset dashboards and select the log topic used by nginx ingress to display nginx access log analysis panels:

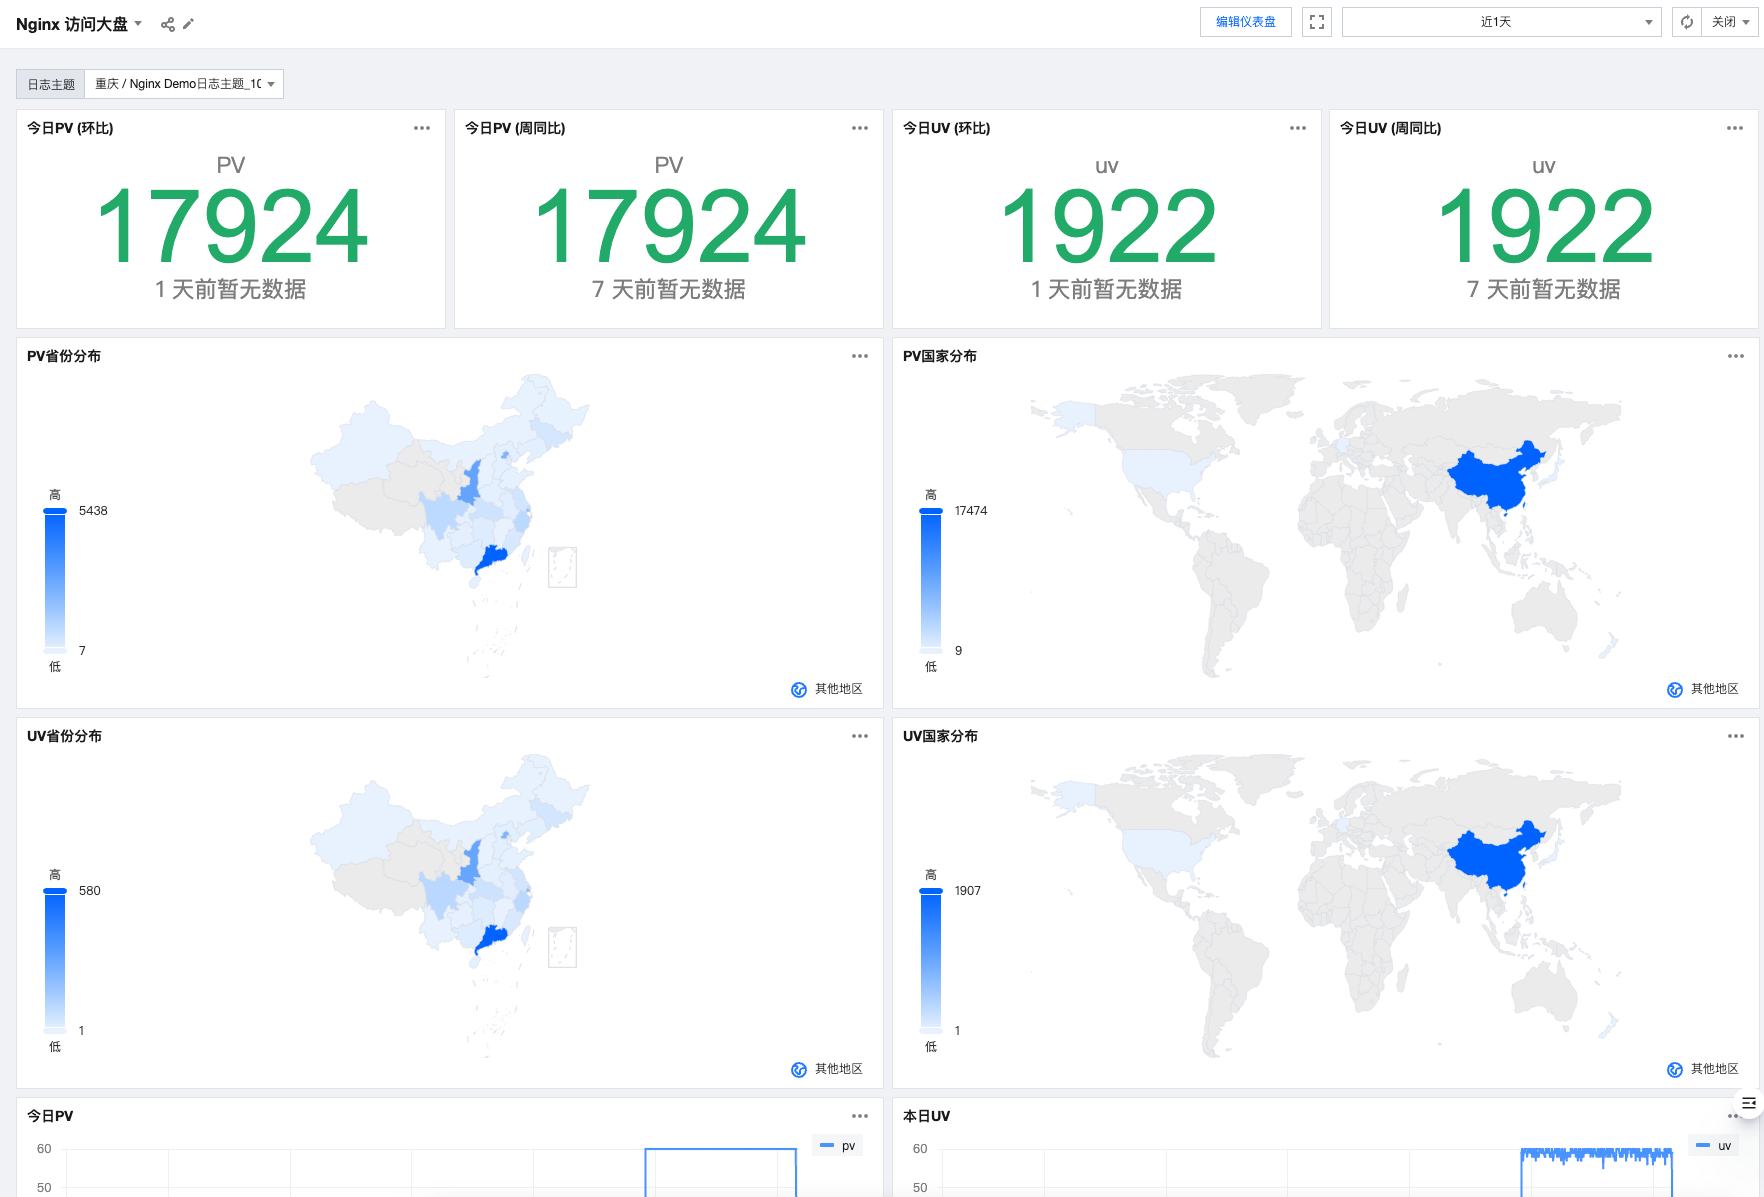
You can even set up alert rules directly through the dashboard:
